In our previous post, we have talked about integration between SCVMM 2012 R2 and SCCM 2012 R2 to enable for fabric update. This round we are going to integrate with SCOM 2012 R2.

By integration Virtual Machine Manager with Operation Manager, you enable Operation Manager to monitor the virtual environment. This includes all components of Virtual Machine Manager such as VMM Server, SQL database that it uses and any virtual machines, services and clouds that it manages.
Performance and Resource Optimization (PRO)
In addition, by integrating VMM and Operations you can take advantages of Performance and Resource Optimization (PRO) features. With PRO enabled management pack, SCOM can detect resource issues or hardware failures in the Virtualization environment.
Through PRO tip, SCOM notifies the operator and recommend an action such as migrating host to a different Hyper-V host.

Check on the result of your test PRO Tip either in the Jobs workspace in the VMM console or in the Operations console in Operations Manager
Virtual Machine Manager Views
There are several views and task become available in Operation Consoles
From here you can view active alerts and health state from a single pane of glass by using Operation Consoles. Use these view to gain a quick view into the health and availability of the VMM environment.


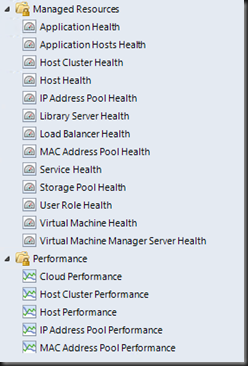
The Managed Resources folder contains several health state that you can view the health of individual VMM components

The Performance folder contains performance view to monitor a component’s current performance and performance over a selected period.

On Microsoft System Center Virtual Machine Manager PRO folder, you can check the result of the PRO test.
Diagram View
Use the diagram view that is located under the VMM View folder to view the overall health of the VMM environment. For example, on below diagram there is an error on VMM environment. Expand the VMM infrastructure component group to view the health of the virtual machine guest, VMM database and any cloud that VMM manages.

Then on alert error, use Health Explorer to troubleshoot failed monitor.

Reporting
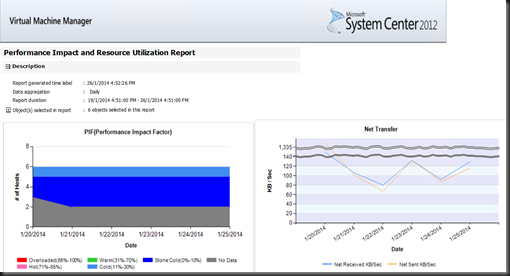
After integration, on Operation Console an additional reports (as shown below) are available for Microsoft Virtual Machine Manager 2012 R2 Reports:

Here is a snapshot of Capacity Utilization on six server which provides details usage for virtual machine hosts and other objects. This report provides an overview of how capacity is being used in your datacenter. This information can inform decisions about how many systems you need to support your virtual machines

Next , Host Group Forecasting (require SQL Server Analysis) which predicts host activity based on history of disk space, memory, disk IO, network IO, and CPU usage.

Host Utilization report shows the number of virtual machines that are running on each host and average usage, along with total or maximum values for host processors, memory, and disk space.

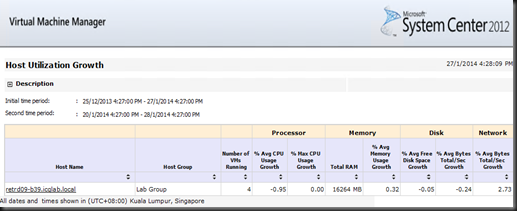
Host Utilization growth report shows the percentage change in resource usage and the number of virtual machines that are running on selected hosts during a specified time period.

Power Saving report shows how much power is saved through Power Optimization. You can view total hours of processor power saved for a date range and host group, as well as detailed information for each host in a host group. For more information about Power Optimization.
SAN Usage Forecasting report (require SQL Server Analysis) for predicts SAN usage based on history.
Virtual Machine allocation report will provides information about allocation of virtual machine):-

Virtual Machine Utilization report provides information about resource utilization by virtual machines, including average usage and total or maximum values for virtual machine processors, memory, and disk space.

Lastly Virtualization Candidates report helps identify physical computers that are good candidates for conversion to virtual machines. You can use the Virtualization Candidates report to identify little-used servers and display average values for a set of commonly requested performance counters for CPU, memory, and disk usage, along with hardware configurations, including processor speed, number of processors, and total RAM. You can limit the report to computers that meet specified CPU and RAM requirements, and you can sort the results by selected columns in the report.


